A data visualization library built styled-components and VX
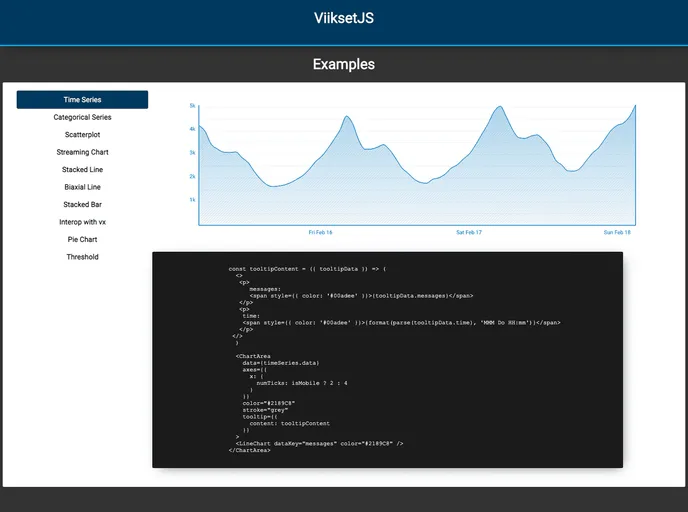
Viiksetjs is an innovative JavaScript graphing library designed specifically for React, blending the simplicity of out-of-the-box options with the customization power of more complex libraries like D3. It provides developers with the flexibility to create visually appealing charts and graphs without diving deep into configuration details. With its recent split into two separate packages, @viiksetjs/web for web applications and @viiksetjs/utils for utility functions, it has become easier for users to incorporate into their projects and harness its features effectively.
Whether you’re a seasoned developer seeking advanced control over your visualizations or a newcomer looking to quickly generate charts, Viiksetjs serves as the perfect middle ground. The library draws inspiration from the vx ecosystem, enabling a seamless interplay between the two, making it an ideal choice for those who value both speed and precision in their data visualizations.