Basic Primitives Diagrams for React. Data visualization components library that implements organizational chart and multi-parent dependency diagrams.
Overview:
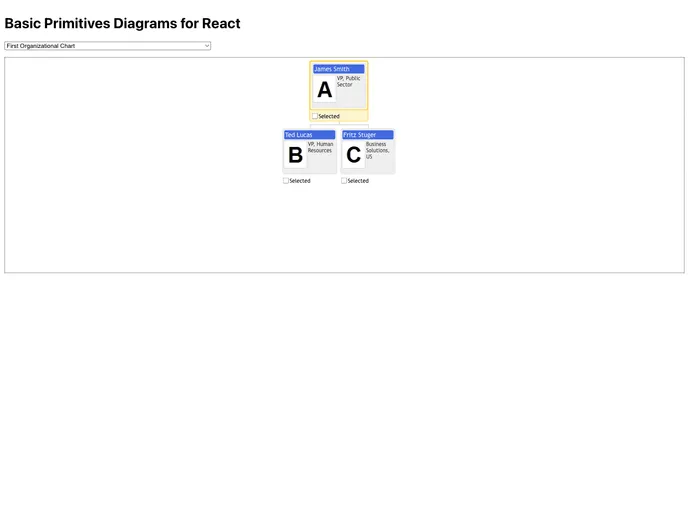
Basic Primitives Diagrams for React is a robust library designed for visual data analysis, offering a comprehensive suite of diagramming components tailored for dependency visualization. Whether you’re working with organizational charts, family trees, or dependency trees, this tool streamlines the process with its automatic layout customization and visually informative node annotations. The emphasis on user-friendliness and adaptability makes it an excellent choice for developers looking to implement sophisticated diagrams without the hassle of complex configurations.
With seamless integration into React applications, this library promises an engaging user experience while maintaining optimal performance through 100% Virtual DOM rendering. It’s an essential resource for developers and data analysts alike, aiming to enhance reporting and analytics capabilities with visually appealing and organized diagrams.
Features:
- Automatic Layout Customization: Automatically arranges diagrams and adjusts spacing for optimal readability, reducing manual adjustments and enhancing clarity.
- No Dependencies on 3rd Party Libraries: This ensures a lightweight integration process while minimizing potential compatibility issues.
- Browser and NodeJS PDF Rendering: Capable of generating PDF documents for easy sharing and reporting of diagrams, catering to various use cases.
- Open Source Accessibility: Download and modify the source code freely, providing the flexibility to tailor the library to specific project requirements.
- User JSX Templates: Utilize familiar JSX syntax for defining diagram structures, making it easy for React developers to get started.
- Cycle React-dnd & React Context Compatibility: Easily integrates with existing React applications by supporting popular state management patterns.
- Various API Options: A range of APIs for configuring diagrams to fit both reporting and analytical scenarios, enhancing data representation’s relevance and effectiveness.
- Enhanced Visual Node Annotations: Adds informative elements to nodes, offering more context and improving the end-user experience when interacting with data.